
Building million scale distributed systems

How much traffic can my backend services handle? 10,000 requests per second? 100,000? How about 1 million? What if it cannot? Can I do something to make it support such a large volume of requests? Where do I even start?
These are questions that we will tackle in this article.
Who Am I?
I am a software engineer keen on learning all the hard things about software engineering. At Alphonso, I had to face a lot of challenges head on while building million scale live streaming services serving HLS and DASH media to the entire world, and I will be pouring a little bit of the wisdom I gathered from those experiences in this article as crisp as I can.
In my experiences out-scaling live streaming services, I have came to the hard conclusion that scaling as a task, although simple in theory, is extremely daunting in practice.
The crux of the problem is that there are just too many suggestions online and wild guesses to make. Upscale load balancers, enhance caching, compress responses, use protobufs, pick the right databases, prevent thread contention, ensure sufficient cpu, memory and network bandwidth per instance/host, and so much more! Finding the precise bottleneck with such myraid of choices is what the difficult part about scaling is.
There is a methodical approach to help tackle this problem.
- First things first, defining the right thresholds for your services and not just on rps (requests per second)
- Building observability across services (Distributed Tracing), within services (Profiling, Network Statistics) both at the service and the host level with the USE method
- Using robust load generators to measure your service capability
- Run experiments and identify bottlenecks
Defining Metrics
Following is what the result from a load generator may look like.
      ↳  99% — ✓ 515506 / ✗ 2673
     checks.........................: 99.48% ✓ 515506      ✗ 2673
     data_received..................: 301 MB 836 kB/s
     data_sent......................: 568 MB 1.6 MB/s
     failed_requests_400s...........: 256    0.71104/s
     failed_requests_503............: 2357   6.546564/s
     http_req_blocked...............: avg=155.18µs  min=0s       med=469ns   max=1.09s    p(90)=287.71µs p(95)=312.53µs p(99)=1.17ms   p(99.9)=9.83ms   p(99.99)=142.32ms count=518179
     http_req_connecting............: avg=104.4µs   min=0s       med=0s      max=1s       p(90)=232.14µs p(95)=254.02µs p(99)=680.58µs p(99.9)=8.71ms   p(99.99)=14.89ms  count=518179
     http_req_duration..............: avg=22.3ms    min=0s       med=25.86ms max=250.55ms p(90)=35.37ms  p(95)=37.49ms  p(99)=97.91ms  p(99.9)=108.65ms p(99.99)=198.9ms  count=518179
       { expected_response:true }...: avg=22.41ms   min=40.32µs  med=25.89ms max=250.55ms p(90)=35.37ms  p(95)=37.54ms  p(99)=97.92ms  p(99.9)=108.7ms  p(99.99)=198.92ms count=515506
     ✓ { name:bidrequest }..........: avg=31.61ms   min=0s       med=27.42ms max=250.55ms p(90)=36.07ms  p(95)=51.71ms  p(99)=98.88ms  p(99.9)=114.53ms p(99.99)=200.58ms count=362980
     http_req_failed................: 0.51%  ✓ 2673        ✗ 515506
     ✗ { name:bidrequest }..........: 0.73%  ✓ 2673        ✗ 360307
     http_req_receiving.............: avg=85.43µs   min=0s       med=31.49µs max=100.92ms p(90)=72.1µs   p(95)=87.19µs  p(99)=1.37ms   p(99.9)=5.9ms    p(99.99)=29.83ms  count=518179
     http_req_sending...............: avg=95.52µs   min=0s       med=91.36µs max=91.02ms  p(90)=116.81µs p(95)=134.23µs p(99)=199.56µs p(99.9)=795.01µs p(99.99)=80.3ms   count=518179
     http_req_tls_handshaking.......: avg=8.21µs    min=0s       med=0s      max=12.73ms  p(90)=0s       p(95)=0s       p(99)=0s       p(99.9)=3.76ms   p(99.99)=4.18ms   count=518179
     http_req_waiting...............: avg=22.12ms   min=0s       med=25.72ms max=250.44ms p(90)=35.22ms  p(95)=37.32ms  p(99)=96.54ms  p(99.9)=105.93ms p(99.99)=196.09ms count=518179
     http_reqs......................: 518179 1439.241365/s
     iteration_duration.............: avg=32.66ms   min=766.67µs med=28.44ms max=1.17s    p(90)=37.24ms  p(95)=53.68ms  p(99)=104.14ms p(99.9)=196.29ms p(99.99)=251.03ms count=362980
     iterations.....................: 362980 1008.176384/s
     passed_requests_200............: 367758 1021.447272/s
     passed_requests_204............: 147748 410.36984/s
     response_time_from_sidecar.....: avg=28.962921 min=21       med=26      max=167      p(90)=35       p(95)=40       p(99)=73       p(99.9)=109      p(99.99)=135      count=360307
     vus............................: 40     min=0         max=183
     vus_max........................: 1100   min=522       max=1100
Notice all the various response times for p90, p95, p99, p99.9 and max, as well as count of request failures. Without these numbers, an rps metric does not really make sense. A system can support infinite rps if you do not define the failure conditions on response times, request failure thresholds, and the validity of the responses received. In addition, you need to understand the traffic pattern, which will largely define your service behaviour. Does your rps signify the average or the peak traffic?
Go ahead and define all those metrics before you move on to measure your system scalability.
Observability
Observability means anything and everything that gives you insight into finding the root cause of problems in your system. Without this, you are shooting in the dark when it comes to finding bottlenecks in a massively distributed system with hundreds of services and replicas.

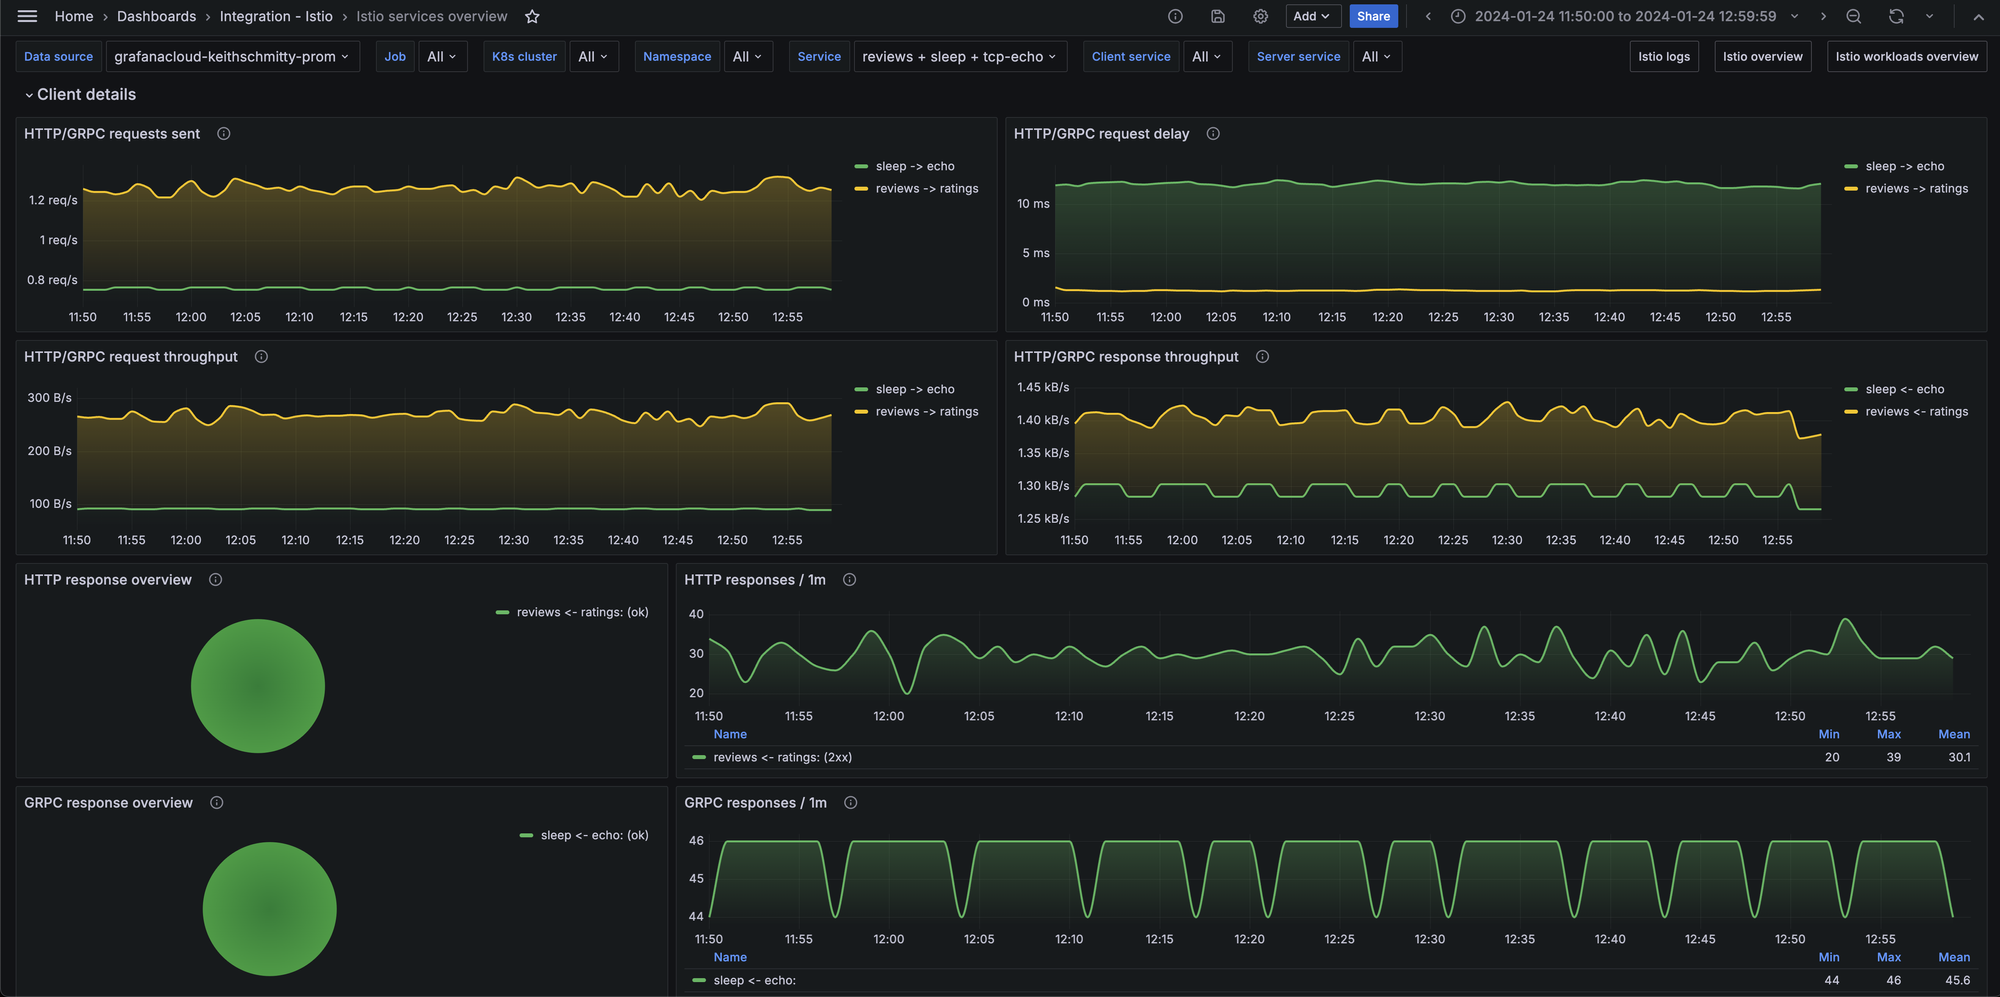
Modern service mesh solutions like Istio provide basic observability out of the box. Additionally, Distributed Tracing solutions like Zipkin, Jaeger and Elastic APM trace the delay across the different services per HTTP request packet. Tracing spans help you identify which service is consuming most of your response duration.
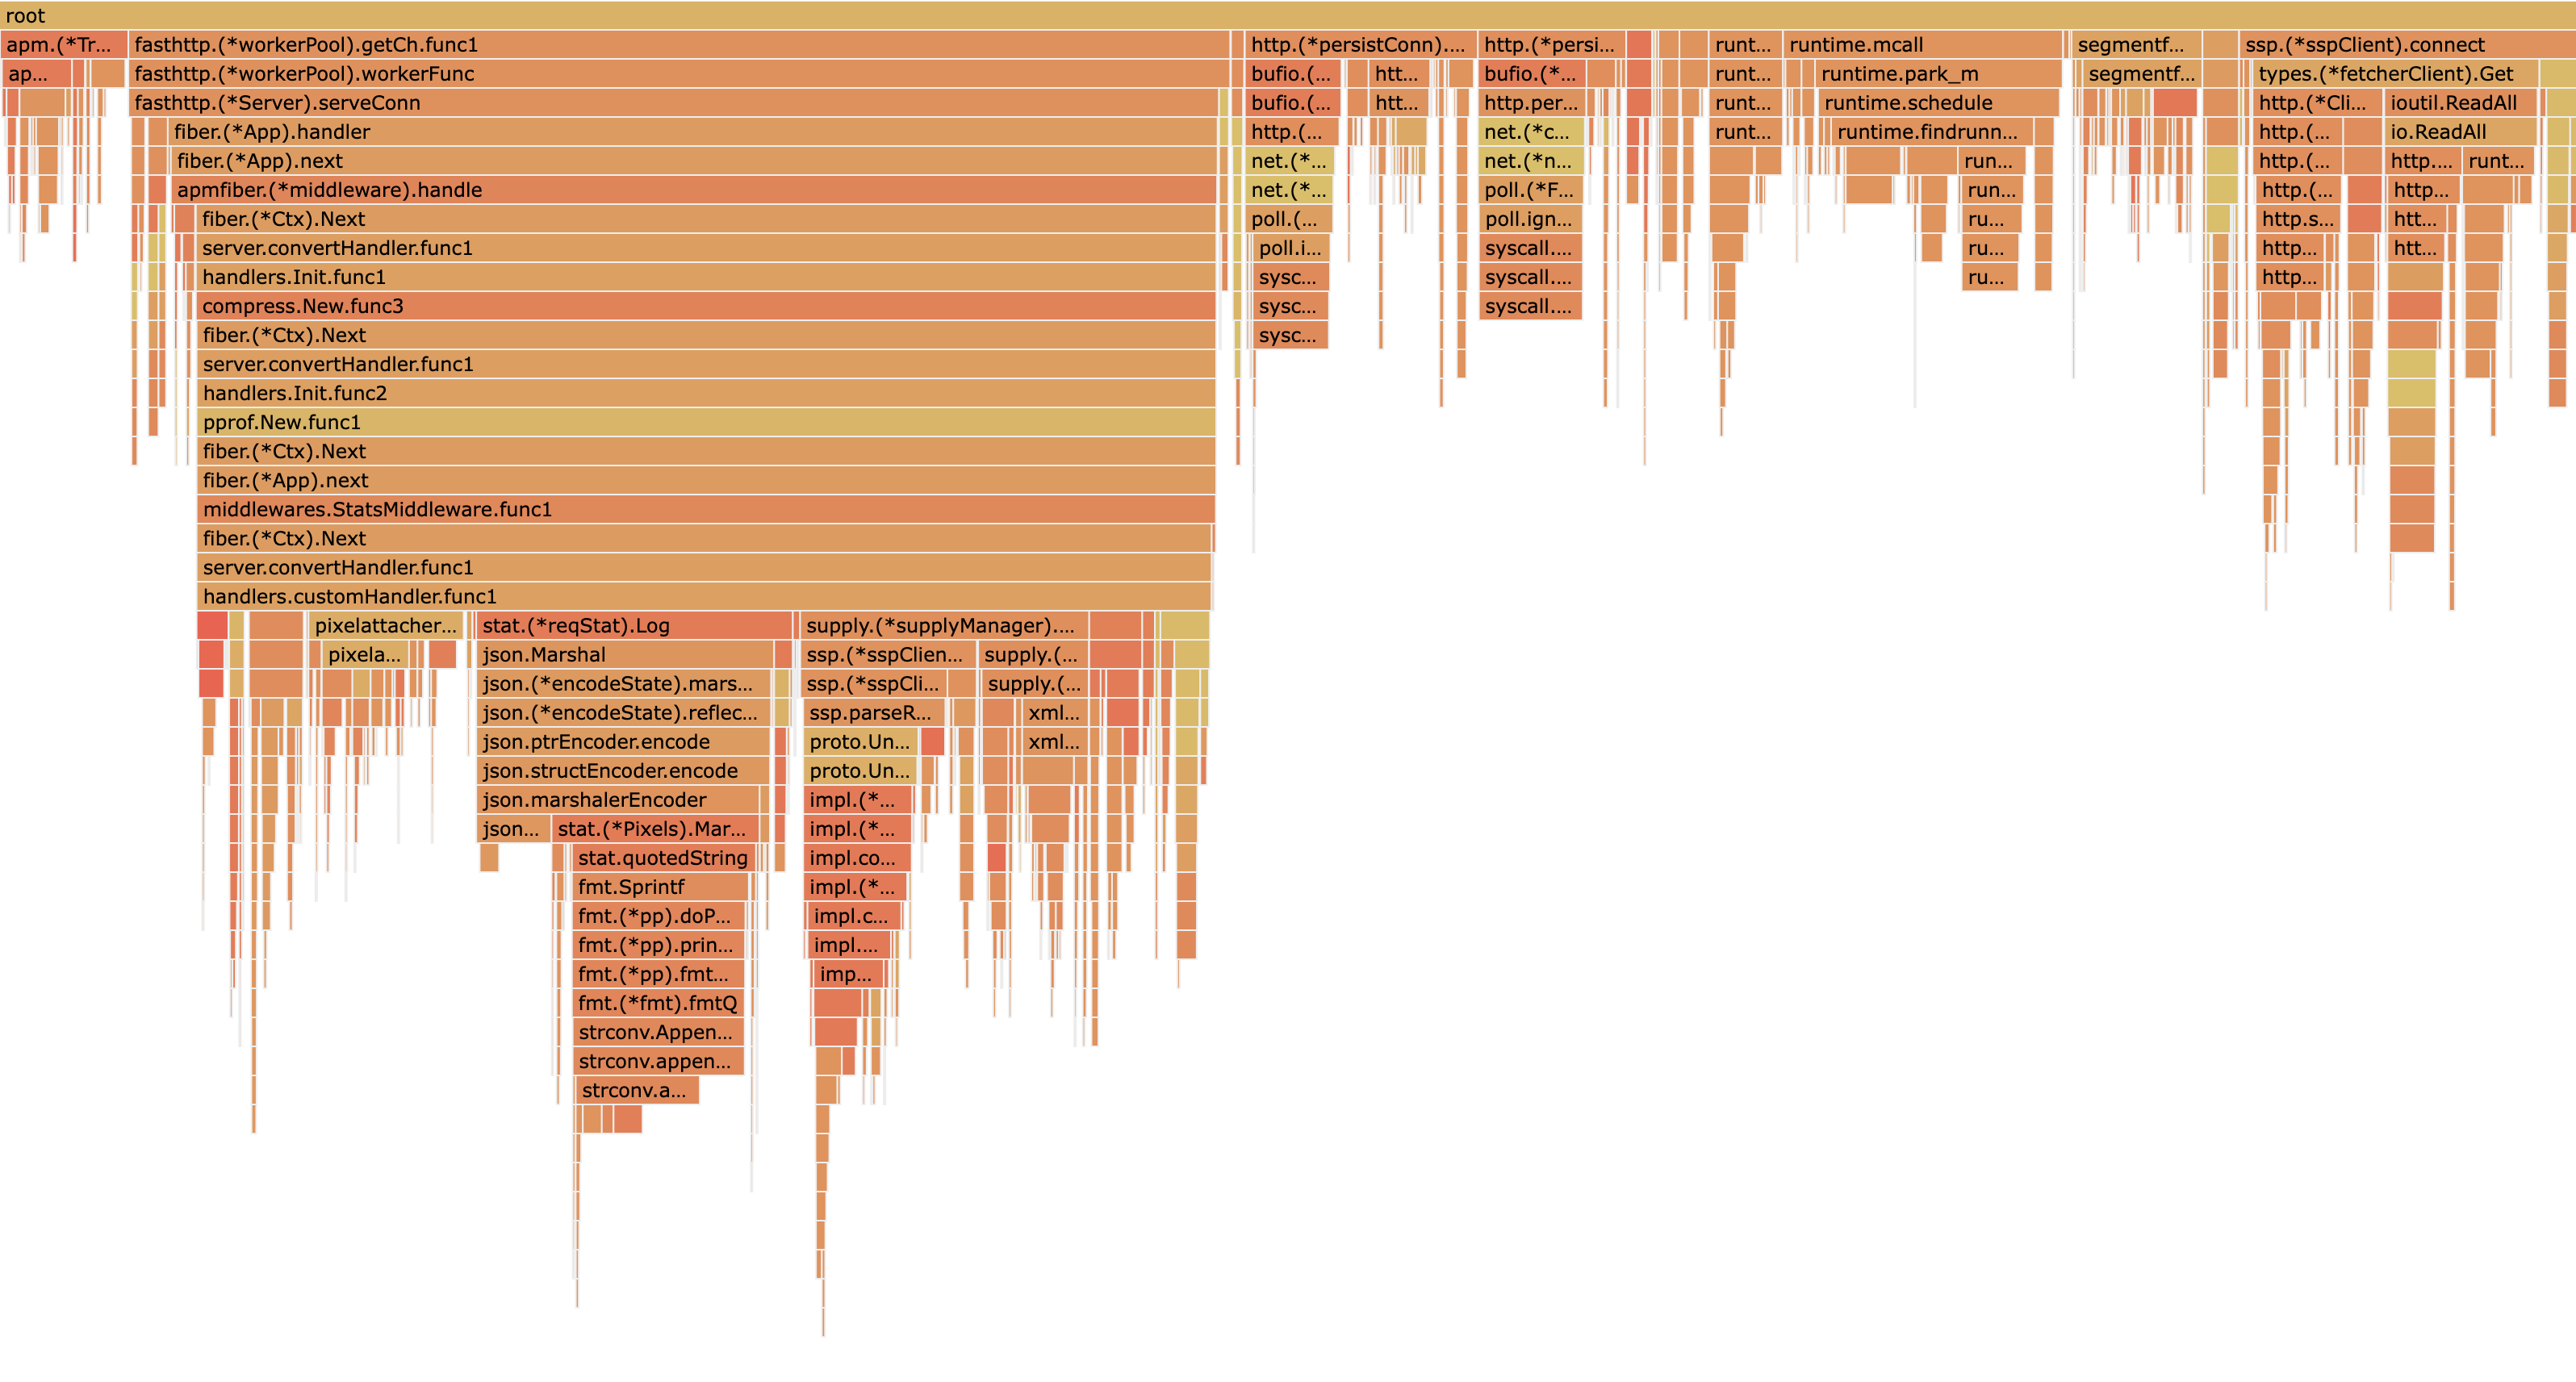
For identifying bottlenecks within a service, profiling is your best friend. Usually, you will find obvious problems, such as copying certain objects unnecessarily or GC tail latencies, well highlighted in flame graphs. Modern languages like Golang have very good profiling support.
But be careful, other non cpu-intensive bottlenecks due to Network, I/O and Scheduler Wait will not be visible via profiling. There is a host of various monitoring solutions - Prometheus, Influx, Datadog to name a few - which you can leverage to collect all kinds of metrics at the host, process (or even pod level on Kubernetes) on top of the distributed tracing solutions noted earlier to identify long duration spans in your code.
It is very important during investigation to understand which problem you actually have out of following,
- hard resource limitations on cpu/mem/net
- or, IO/Network/Scheduler bottlenecks
The recommended approach here is to identify if it is the first situation by looking for any saturation metrics. If not, by process of elimination you have to tackle for the second category of issues, which is the trickier of the two.
Saturation Metrics & the USE Method
Resource statistics like TCP Retransmissions and CPU throttlingnr_throttled(number of times tasks in a cgroup have been throttled), for example, are very important in identifying an issue due to resource limitations. Usually, these saturation-type metrics are much more indicative of the actual issue rather than the standard utilisation-type metrics for cpu, memory or the network. This proves quite well the importance of understanding the three different types of metrics highlighted by the infamous, Brenden Gregg, in his USE method.
This is especially helpful in practice, due to the distinction and weight given to Saturation and Errors, on top of the more commonly used Utilisation metrics that we always rely on.
Load Generator

Grafana K6 is a very good HTTP load generator with tons of features. Paired with the Operators that run on Kubernetes, you can easily generate load upwards of a million rps with just a handful of machines.
It is very easy to get started with k6 scripts to generate load.
import { sleep, check } from 'k6';
import http from 'k6/http';
import { Counter, Trend } from 'k6/metrics';
import exec from 'k6/execution';

const responseTimeMetric = new Trend('response_time');
const failureCounter = new Counter('failed_requests');

export const options = {
    summaryTrendStats: ['avg', 'min', 'med', 'max', 'p(90)', 'p(95)', 'p(99)'],
    stages: [
        { duration: '1m', target: 10 },
        { duration: `5m`, target: NUM_USERS },
        { duration: '30s', target: 0 },
    ],
    thresholds: {
        'response_time': ['p(90)<500', 'p(95)<750', 'p(99)<1000'],
        'failed_requests': ['count<10'],
    },
    discardResponseBodies: true,
};

export default function () {
    const startTime = Date.now();
    const response = http.get("http://your/url", {});

    responseTimeMetric.add(Date.now() - startTime);
    check(response, { 'status was 200': (r) => r.status === 200 });

    if (response.status >= 400) {
        failureCounter.add(1);
        console.log(`HTTP-ERROR: ${response.status}`);
    }

    sleep(Math.max(0, 2 - (Date.now() - startTime) / 1000));
}
There are tons of other options as well, such as Apache JMeter. These will help you measure your system capacity very quickly, or simulate scenarios where your system is failing to support the desired numbers.
Identify bottleneck and Resolve
Now, what remains is only to run tests, look for bottlenecks and resolve it.
"Scaling: Where the hard part isn’t fixing the mistake, it’s finding which mistake to fix."
If you are an experienced software engineer, you would realise that in finding a bug is usually harder than fixing it. But with observability and good load testing frameworks you already have half the work done!
For instance, we had found that from the perspective of the streaming service, Redis API calls were taking the majority of time away from the response duration. On the Redis server side, latency metrics showed that the max response time was well below 200 ms! So where is the problem?
With proper observability integrated into the system and simulation of various scenario by running experiments, we were able to determine that the actual culprit was the TCP connection creation Syscall towards the kernel! It was taking more than 1 second. This heavily degraded our p99.9 response times while average response times remained well within 500ms due to already existing connections.
Resolution was simply to use Redis pipelining to ensure multiple commands can be executed over a single TCP connection and maintaining a warm pool of TCP connections towards Redis using minIdleConnections client configuration. Easy!
We also ensured that there were larger and fewer service instances, so that they can share the connections even further.
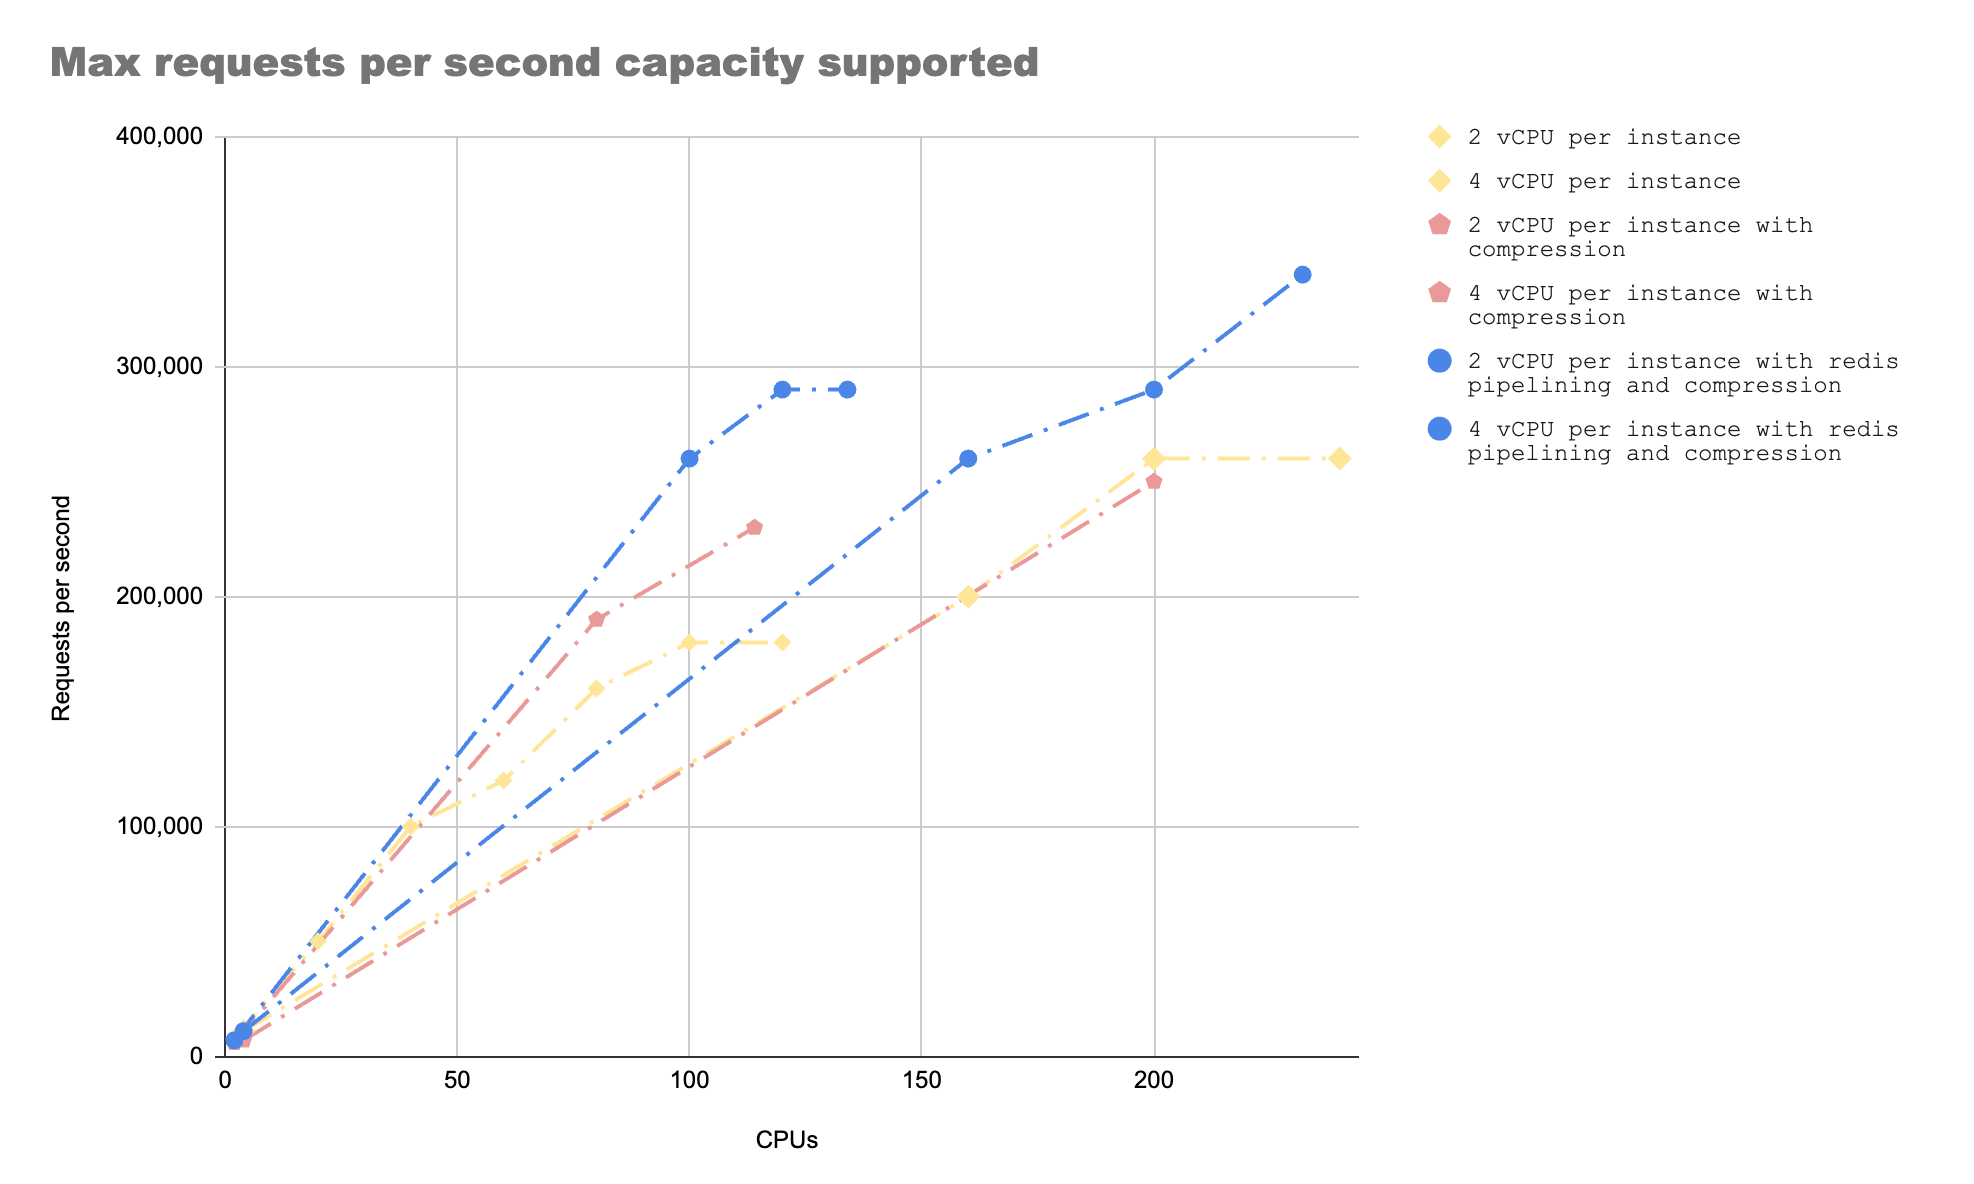
Following is what the capacity numbers looked like after all these experiments. The bottleneck disappeared when we used Redis Pipelining with 4 vCPU per instance.
Conclusion
Hope that helps in your journey of scaling distributed systems. Remember it is an iterative exercise and more about building the muscle.
Have a Good day!